The application supports online trading via EUROCORP Financial Services SA.
Password is required for using the application.
For more information contact +30 210 7263600 or via email at [email protected]
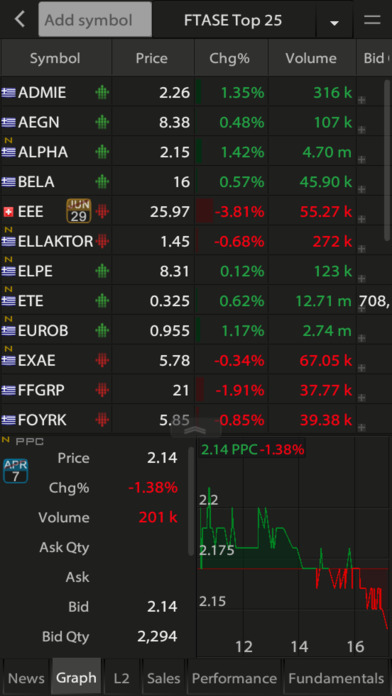
The ZTradePlus application provides professionals or simple investors with the easiest and most reliable way to monitor stock exchanges in real time. With a depth of prices, strong technical and fundamental analysis and a streamline operation, the application allows professional monitoring with minimum hardware and software requirements.
Monitoring
• Monitoring of markets in real time, with a depth of prices.
• Market statistics (winners-losers, distribution of values).
• Dynamic categories (greatest increase, drop, volume, value, volatility, volume for buyers-sellers, lowest bid-ask)
• Unlimited number of portfolios/shares to monitor.
• Dynamic options for the configuration of displayed fields
• 90 information fields per symbol.
Technical Analysis
• Moving Averages: Simple, Exponential, Weighted, Triangular, Endpoint, Linear Regression, Adaptive, Bollinger Bands, Moving Average Envelope
• Price Indexes: Directional Movement (ADX), Average True Range (ATR), MACD, Relative Strength (RSI), Price Oscillator (PrO), Stochastic Oscillator (StO), Chaikin A/D Oscillator (ChO), Detrended Price Oscillator (DpO), Commodity Channel (CCI), Accumulation/Distribution (AD), Momentum (Mom), Price Rate Of Change (ROC), Williams %R (WR), Ease of Movement (EoM), Aroon Indicator (AI)
• Volume Indexes: Mass Index (Mass), Volume Price Trend (VPT), On Balance Volume (OBV), Positive Volume (PVI), Negative Volume (NVI), Money Flow (MFI)
• Drawing Lines: Gann Fan, Fibonacci Arcs, Fibonacci Fan, Fibonacci Retracements, Fibonacci Time Zones, Speed Resistance Lines, Quadrant Lines, Trend Line, Horizontal Trend Line, Vertical Trend Line
• Ratio of two stock prices
• 90-day intraday data: 5, 10, 30, 60, 120, 240 minutes
• 5-year daily data
• 10-year weekly data
• 15-year monthly/quarterly data
• Absolute reliability of indexes that produce the same results with Metastock to the fourth decimal point (for the same data file).
Fundamental Analysis
• All key financial share indexes (Market Value, Value/Sales, Equity, Value/Book Value, EPS, P/E, Dividend, Dividend Yield, Sales, Sale Changes, Profits, Profit Changes, Profit Margin) on the basis of the last balance sheet.
Market Overview
• The performance of all stocks and indexes (Performance, Maximum, Minimum, Average Volume, Average Value) for periods of weeks, months, quarters, semesters, years, from 1/1.
• Market statistics (winners-losers distribution of values) for each period.
• Dynamic categories of period (winners, losers, volume, value, volatility, volume for buyers-sellers, lowest offer-demand).
Alerts
• Alerts based on the price and/or volume and/or change of a symbol.
Personalisation
• Personalisation of settings based on user preferences for the entire interface. Each time the user logs in, all desired forms open automatically to create the desired interface. The settings are stored in the server allowing users to have the desired interface, independently of the used computer or location.


